Watch each particle move, and read its size, charge, and markers.
ZetaView® Evolution tracks thousands of individual nanoparticles in real time — turning Brownian motion into hydrodynamic size, a whole-cell scan into absolute concentration, an applied field into zeta potential, and fluorescent labels into specificity. One instrument, six measurements, no calibration curves.
One bench-top platform, every measurement.
Up to four excitation lasers, a high-sensitivity CMOS camera, and a quartz-glass measurement cell work together under ZetaSphere® software — so size, concentration, zeta potential, fluorescence, and colocalization all come from the same particles, in a single run.

Inside the platform
- Up to four excitation lasers — selected from 405 / 488 / 520 / 640 / 660 nm, doubling as scatter and fluorescence sources.
- High-sensitivity CMOS camera — records the light each particle scatters, and its fluorescence, particle by particle.
- Quartz-glass measurement cell — zeta potential measured directly inside the cell, with no disposables.
- ZetaSphere® software — one-click multiparameter acquisition, live statistics, and full sample reporting.
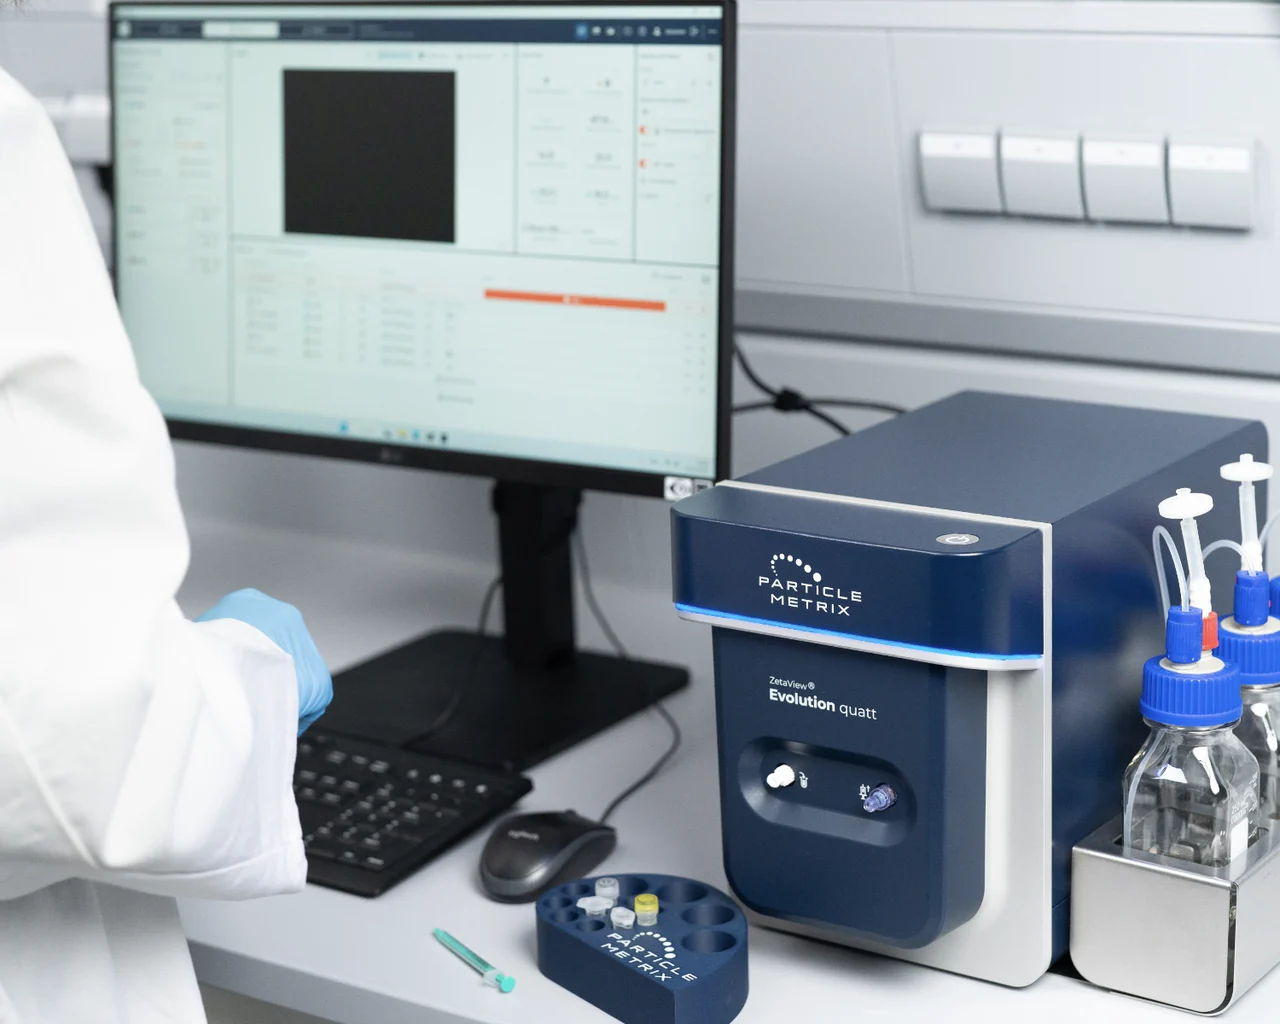
Six measurements, one sample.
Nanoparticle tracking analysis follows particles one at a time rather than averaging the whole suspension. That single difference is what lets ZetaView resolve a polydisperse sample into its true size distribution, count particles in absolute terms, measure their surface charge, and separate a genuine subpopulation from background.
The panels below illustrate the measurement principle behind each capability. Adjusting a parameter shows how the instrument's read-out responds to a change in the sample, the label, or the settings — an aid to understanding the technology, not a stand-in for validated measurement data.
Particle size distribution
Brownian motion is faster for small particles and slower for large ones. The Stokes–Einstein relation converts each tracked path into a hydrodynamic diameter, and thousands of particles build a full distribution — not a single average.
Drag polydispersity and switch sample type. Watch D10 / D50 / D90 and the span respond — a monodisperse standard collapses to a sharp peak; a real EV prep spreads wide.
Concentration Scanning Technology
ZetaView® Evolution sweeps the laser through the entire measurement cell, illuminating each plane in turn and capturing every particle it crosses. Counting the whole volume — not a single fixed field — yields an absolute, calibration-free concentration that stays comparable across sample types and across scatter and fluorescence channels.
Watch the illuminated plane scan the whole cell. Switch the laser: in scatter it captures every particle; in fluorescence only labelled particles light up. Because the full volume is scanned, the count doesn't depend on camera gain or laser intensity.
Zeta potential
Apply an electric field and charged particles migrate; their velocity reveals the zeta potential — the effective surface charge that governs colloidal stability. ZetaView measures this in the same cell, on the same particles it just sized.
Sweep the pH. Near the isoelectric point the charge collapses toward zero and particles aggregate; push pH away and |ζ| climbs past 30 mV into the stable regime.
Fluorescence detection
Light scatter sees every particle — vesicles, aggregates, and contaminants alike. Add a fluorescent label and ZetaView counts only what carries your marker, separating specific signal from a noisy background in the very same sample.
Toggle scatter and fluorescence, pick a tetraspanin channel, and set how many particles carry the marker. Specific count is always a subset of total scatter — that gap is your specificity.
Colocalization analysis
Two labels, two lasers. ZetaView detects each particle in both fluorescence channels and resolves the population into three groups — CD9-positive, CD63-positive, and the colocalized double-positive vesicles that carry both markers at once.
Raising the colocalization degree moves events into the double-positive bar — the co-expressed subpopulation a bulk assay averages away. Colocalization NTA (C-NTA) needs at least two lasers, available on the Twin and Quatt configurations.
Subpopulation analysis
Real preparations are mixtures — vesicles of different sizes and surface charge, labelled and unlabelled particles, and free-protein debris all overlap. Resolving a subpopulation by size, zeta potential, and fluorescence together isolates a genuine subset and reports its count, fraction, and characteristic size.
Set the size and charge gates to enclose a cluster, then switch to marker-positive to keep only fluorescently labelled particles. The instrument reports what falls inside — separating a true EV subset from background that any single parameter would blur together.
From EV discovery to lot release.
The same multiparameter read supports academic discovery and regulated manufacturing — characterising biological nanoparticles wherever size, count, charge, and markers all matter.
Extracellular vesicles
Size, concentration, and tetraspanin profiling with per-EV fluorescence.
Lipid nanoparticles
Size and zeta for LNP stability in mRNA and gene-delivery work.
Viruses & VLPs
Titre, integrity, and stability for diagnostics and vaccine development.
Biopharma QC
Lot-to-lot consistency and stability studies for GLP/GMP workflows.
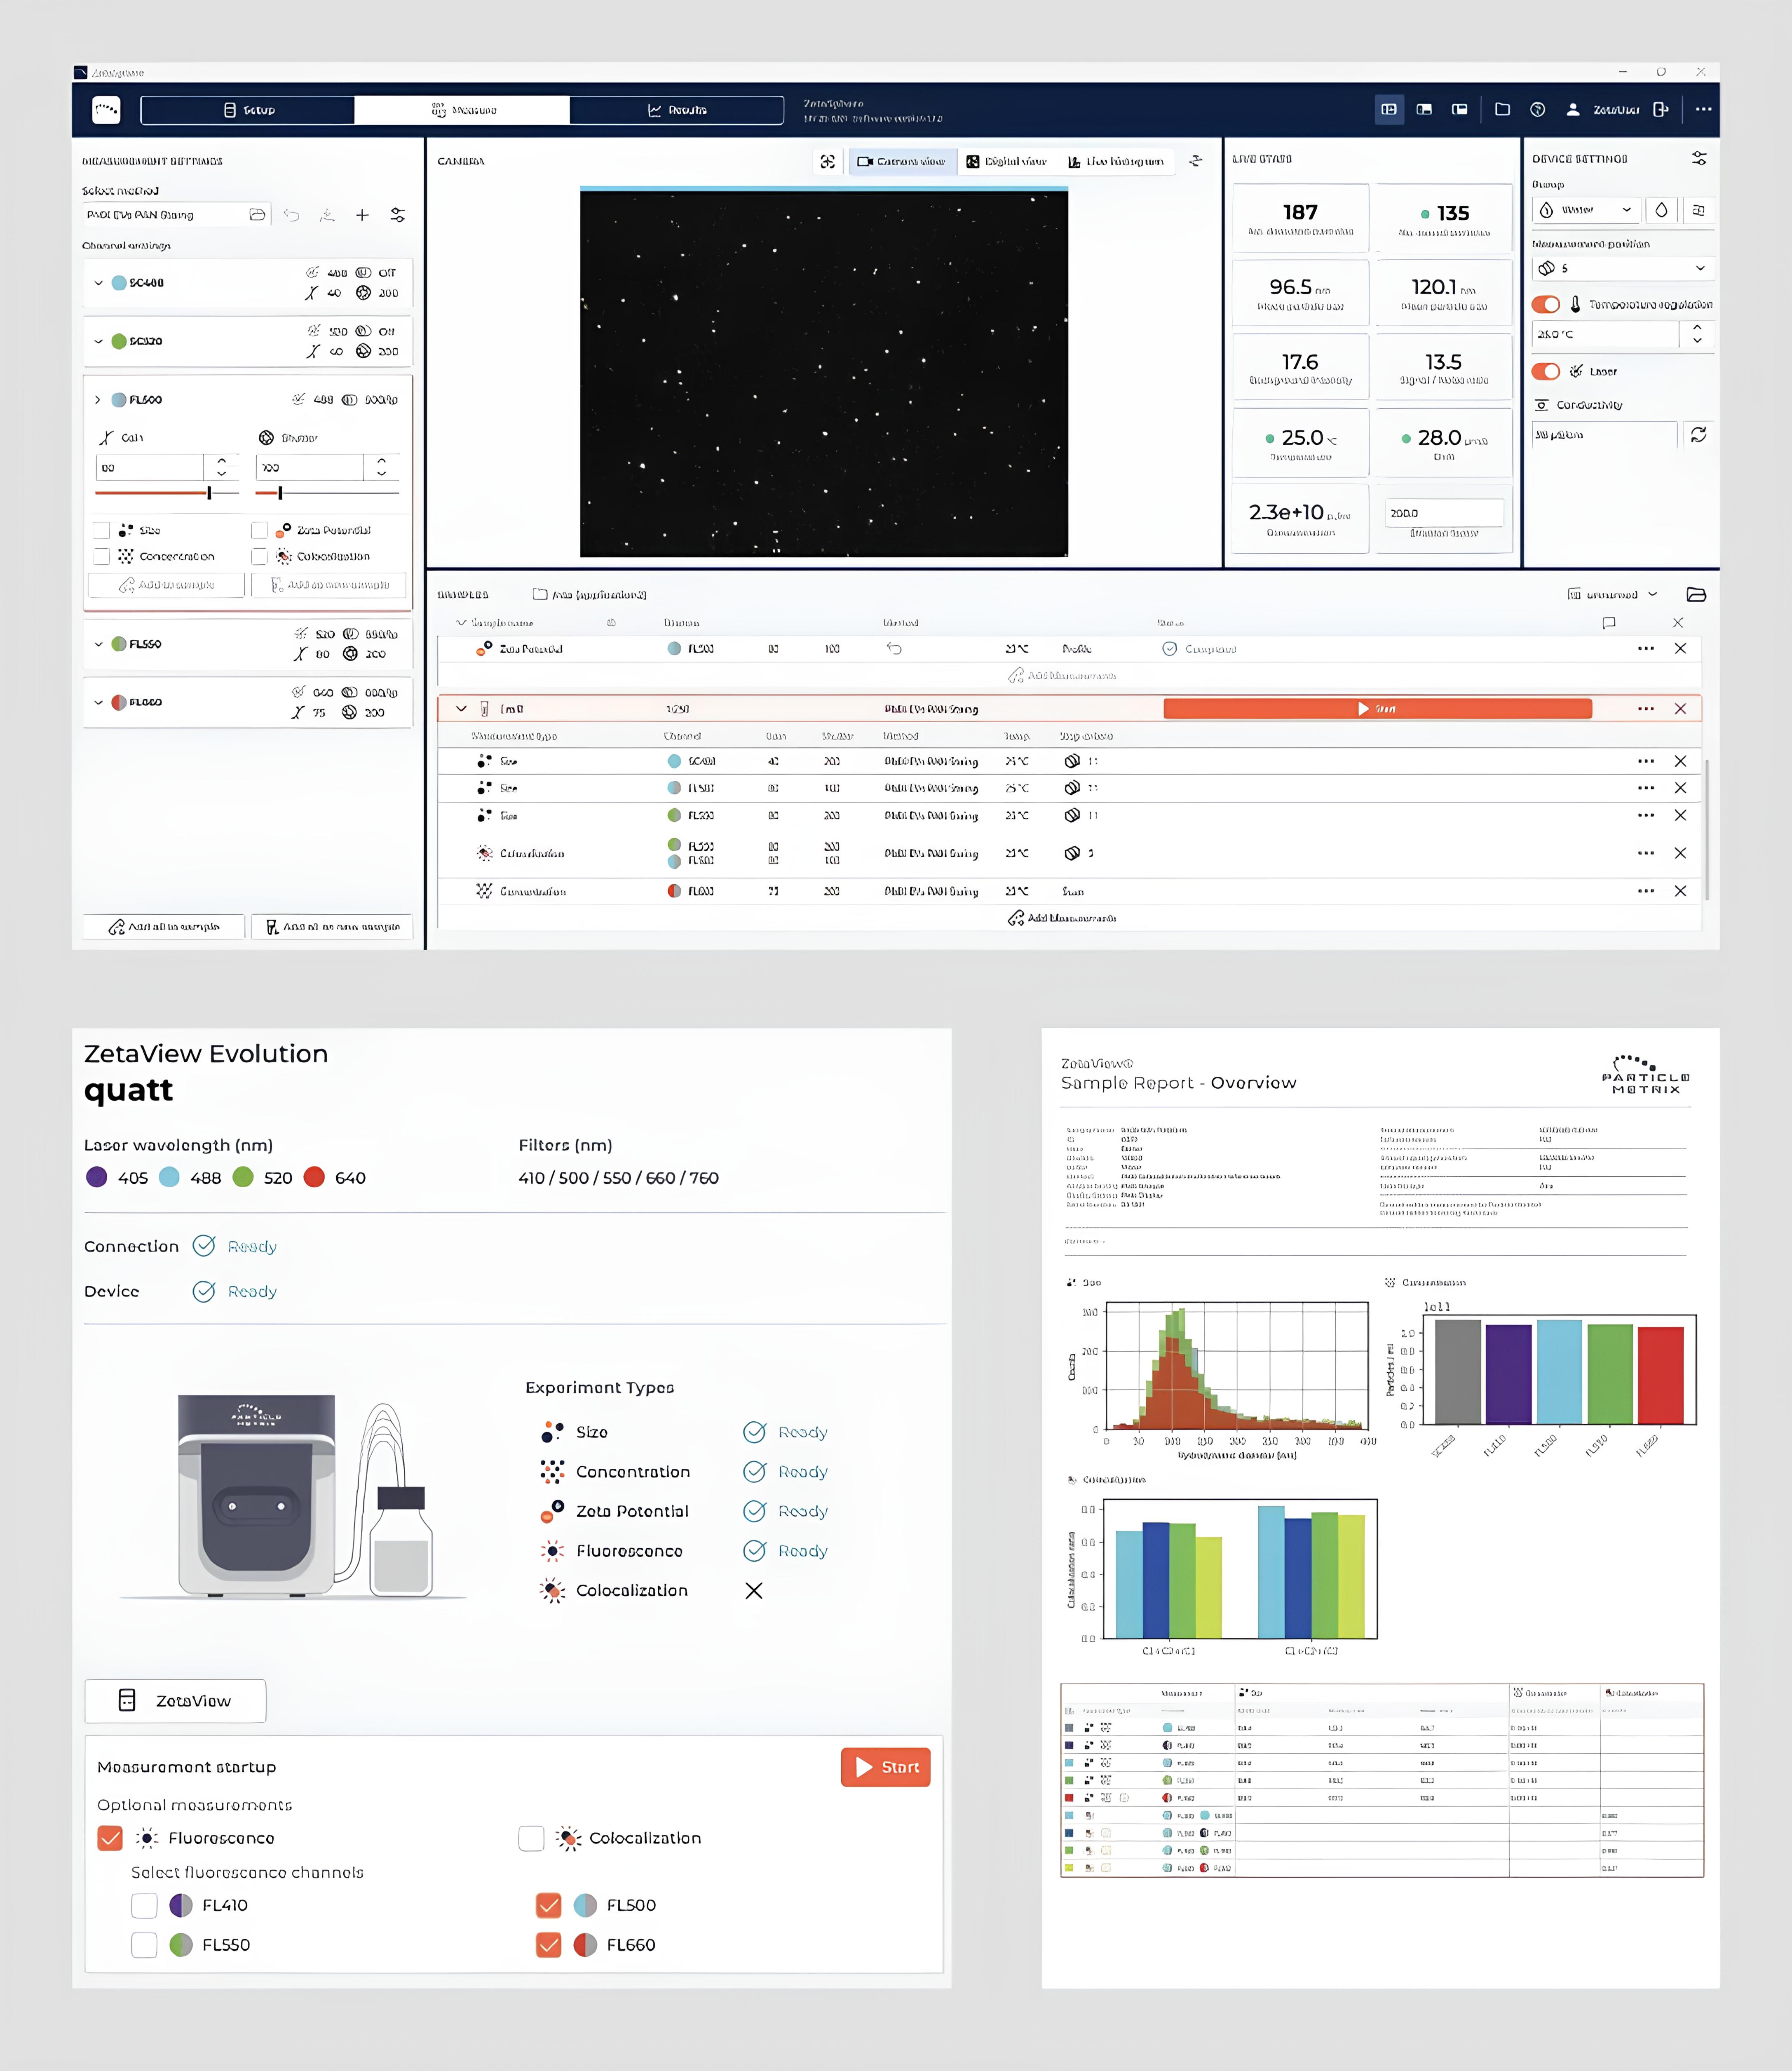
Adopted across EV, LNP, and virus research.
ZetaView® is used by research groups and biopharma teams worldwide for extracellular-vesicle, lipid-nanoparticle, and viral-vector characterisation — every parameter captured and reported in ZetaSphere®.




Reproducible data, calibration-free.
Widely cited platform
An NTA system established across peer-reviewed EV, virus, and nanomedicine literature.
One cell, one workflow
Size, concentration, zeta, fluorescence, and colocalization on the same particles — no instrument-hopping.
Data integrity built in
ZetaSphere® logs database events and predefined settings for reproducible, auditable multiparameter workflows.
Bring multiparameter NTA to your biology.
Request a demoFor Research Use Only. Not for use in diagnostic procedures.